
Tank Farm & Inventory
Fuel losses at terminals: sources, calculation and control
Fuel losses are the gap between book stock and measured stock at 15 °C. This guide covers the formula, the usual causes and daily reconciliation.
- Topic
- Tank Farm & Inventory
- Updated
- 13 November 2026
- Reading time
- 6 min
- Sections
- 8
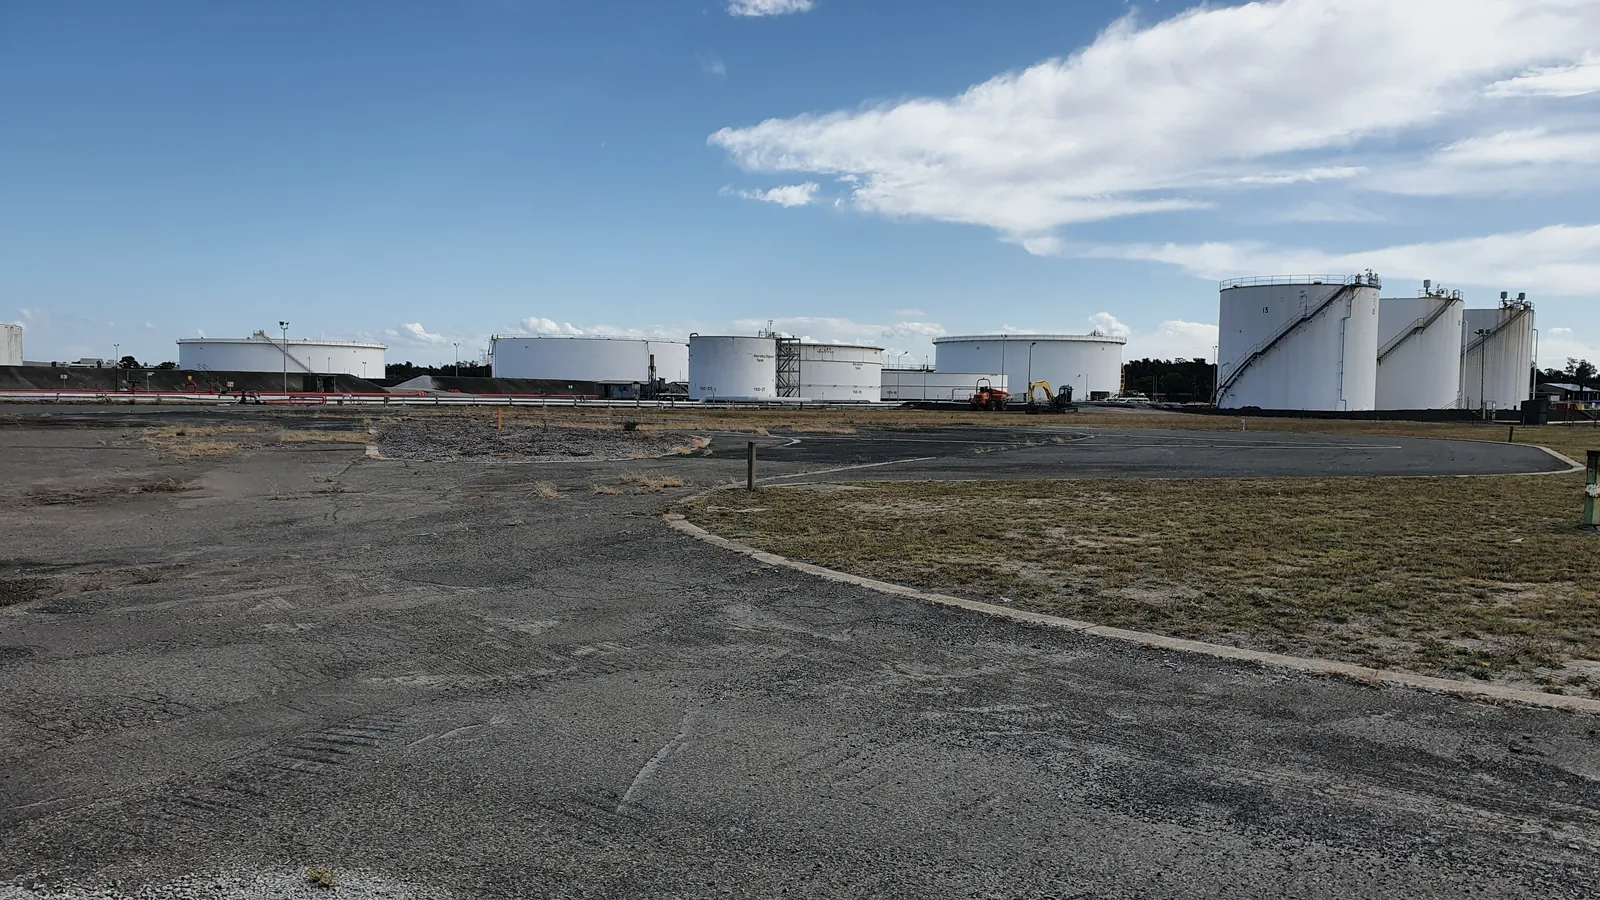
Fuel losses are the difference between the volume that should be in stock according to the records and the volume actually measured, both at standard temperature; the causes include evaporation, measurement error, temperature differences, leaks and recording errors.
Every terminal has a loss figure, whether it calculates one or not. The question is whether the figure reflects real product leaving the system or only the way it is measured. The automatic tank gauge (ATG) and the tank management system provide the measured side; receipts and deliveries from ship, pipeline and meters provide the book side. This guide shows how to put the two together and where differences usually come from.
Calculation
The basic loss formula
The formula is simple arithmetic; the discipline lies in the inputs and in taking them the same way every day.
Start from the measured stock at the opening of the period. Add every receipt and subtract every delivery recorded during the period. The result is the book closing stock, the volume that should be in the tanks. Measure the tanks again at the close. The difference between book and measured closing stock is the loss, or a gain if it is negative.
API MPMS Chapter 12.1.1 makes the condition for this to work explicit: parties can only reconcile volumes if they start from the same basic information. In practice that means the same tables, the same temperature basis and the same cut-off time for every figure in the formula.
All volumes at 15 C (GSV)

Book closing = opening stock
             + receipts
             - deliveries

Loss (gain)  = book closing - measured closing

Loss %       = loss / basis x 100
               basis = throughput or receipts,
as the company procedure definesTemperature
Why every figure must be at 15 °C
A tank received cool at night and measured warm at noon appears to hold more product, though nothing has entered it. Comparing volumes at different temperatures manufactures losses and gains on paper.
The Measurement Canada table for gasoline at 730 kg/m³, derived from Table 54B, shows the size of the effect. The volume correction factor falls from 0.9937 at 20 °C to 0.9811 at 30 °C, a change of about 1.3 percent. On a large receipt that difference dwarfs most real losses. Every opening, receipt, delivery and closing figure must therefore be converted to gross standard volume before it enters the formula. The volume correction factor guide shows the method step by step.
Sources
Where losses come from and how to spot them
Losses fall into two groups: product that physically leaves the system, and product that only appears to leave because of how it was measured or recorded. The second group is usually larger, and cheaper to fix.
Evaporation is real but predictable. API MPMS Chapter 19.1 (fixed-roof tanks, 5th edition, 2017) and Chapter 19.2 (floating-roof tanks) give methods to estimate it from tank type, roof fittings, vapour pressure and weather. An estimate gives a baseline: a loss well above it points elsewhere. Leaks and passing valves show up as level movement in a tank that should be still. Measurement and recording problems show up as patterns, such as losses that follow the shift roster or a single meter.
| Criterion | Typical example | How to detect it | Evidence to keep |
|---|---|---|---|
| Evaporation | Breathing and working losses from roofs and vents | Compare with an API MPMS Chapter 19 estimate | Tank data, product, weather |
| Measurement error | Gauge offset, meter drift, wrong table | ATG against dip, meter against tank | Verification and proving records |
| Temperature and density | Volumes compared at different temperatures | Recalculate every figure at 15 °C | Temperatures, densities, VCF used |
| Leaks and passing valves | Level falling in an idle tank | Standing-tank trend in the TMS | Level history, valve line-up |
| Recording and timing | Cut-off mismatch, typing errors | Losses that follow shifts or days | Ticket audit trail |
| In transit | Compartments opened between terminal and station | Seal open and close events | Seal log linked to the trip |
Procedure
Daily reconciliation in five steps
Daily reconciliation turns the loss formula into a routine, so problems surface within a day instead of at month end.
The steps below assume a TMS that issues tank tickets and a TAS or meter system that records deliveries. The order matters: freeze the data first, explain the movements second, and only then calculate. A large difference found on day one is usually a recording problem that is still easy to trace, because the people involved still remember the sequence and the documents are still on the desk.
Close the books at a fixed time
Take closing tank readings at the agreed cut-off and lock the tickets.
Collect all movements
Receipts from ship or pipeline, deliveries from meters, transfers between tanks.
Convert to 15 °C
Use the same tables and densities for every figure.
Calculate per product and per tank
Book closing minus measured closing, then the percentage on the agreed basis.
Explain or escalate
Investigate any value beyond the company limit before the next cut-off.
Policy
Loss tolerance: who sets the limit
There is no single loss tolerance that applies to every terminal. The acceptable figure is set by the company, by supply and transport contracts, and sometimes by the authority that governs a particular transaction.
A tolerance only means something when its basis is written down. A limit quoted as a percentage needs the denominator, the period, the product and the temperature basis. Without those, two departments can report the same day as within and outside tolerance. Ask the commercial or finance team for the current written limit rather than relying on a figure passed around the control room.
Separate limits by cause where possible. An evaporation allowance estimated for each tank, a measurement allowance based on the instruments in use, and zero allowance for unexplained movements give the operations team a clearer target than one combined percentage.
- Basis
- Throughput, receipts or stock, stated explicitly
- Period
- Per day, per month or per transfer
- Volume basis
- Gross standard volume at 15 °C
- Scope
- Per tank, per product or per terminal
- Owner
- Who approves the limit and who acts on a breach
Detection
Is an ATG enough to detect losses?
An ATG is necessary but not sufficient. It shows what is in the tank, not where the missing product went. Answering the second question needs meter data, documents and observations from the field.
A gauge with live history is good at one job: watching a tank that should not move. A slow fall in level in an idle tank, compared with the same tank on other days, points to a leak or a passing valve. For losses during transfers, the tank figure must be compared with the meter or the ship figure, and the meter needs its own verification.
Remember also the gauge limits: OIML R 85 allows 4 mm after installation, which on a wide tank is a meaningful volume. Small daily losses need a trend over many days, not a single reading. The same trend chart also separates a steady leak from a one-off measurement difference.
The INTEGRA TMS keeps the history that this comparison needs. Projects such as the Cikampek tank-monitoring upgrade close with functional tests so the data is trusted before anyone draws conclusions from it.
In the field
Losses after the gate: sealed compartments
Product can also disappear after it leaves the terminal, between the loading bay and the fuel station. Terminal reconciliation cannot see this; the evidence has to travel with the truck.
The CATALYST Digital Seal (CT-PS) fits electronic seals to tank-truck compartments and records every open and close event, linked to the trip, through a vehicle gateway and a fleet application. In the Smart Seal Lock project at Pertamina Pulau Baai in 2025, the hard part was installation on the truck itself. The router and main control unit had to sit where they work, stay maintainable and add no risk on a vehicle carrying flammable fuel.
On the delivery side of the terminal, metered loading closes the other gap. The integration of meters 5 and 6 at the Jambi terminal brought meter data into the filling-shed application, so dispatched quantities are recorded directly instead of being typed in. Tank figures, meter figures and seal events together leave little room for unexplained losses.
Standard volume leaving the tank.
Hover, focus or tap a step to read its note.Investigation
Investigating a loss that breaks the limit
When a day closes outside the limit, work from the desk to the field. Paper causes are faster to check and far more common than physical ones.
- Check the data. Confirm the cut-off, look for missing or duplicated tickets, and recheck densities and temperatures used for the VCF.
- Re-measure. Dip the tanks involved and compare with the ATG, with the tanks at rest.
- Check the meters. Compare meter totals with tank movements and review the latest proving or verification records.
- Check the line-up. Look for transfers between tanks that were not booked, and valves left open between tanks or to drains.
- Walk the tank farm. Inspect bunds, sumps, water-draw points and pump seals for product.
- Record the cause. Write what was found and what was changed, so the next investigation starts from evidence.
Water draining deserves a special mention. Draining bottom water by hand without watching the interface sends product to the separator, and that loss never appears in any meter.
Terms used in this guide
- Losses
- Product missing when book stock is compared with measured stock.
- Gain
- A negative loss: measured stock higher than book stock.
- Book stock
- Opening stock plus receipts minus deliveries, from the records.
- Measured stock
- Stock calculated from tank readings at the cut-off time.
- Cut-off
- The agreed moment at which all figures for a period are fixed.
- Passing valve
- A closed valve that still lets product through.
- Evaporative loss
- Product lost as vapour from tank roofs and vents, estimated with API MPMS Chapter 19.
Frequently asked questions
How do you calculate fuel losses?
Fuel losses equal opening stock plus receipts minus deliveries, minus the measured closing stock, with every figure at 15 °C. Dividing by the agreed basis, such as throughput, gives the loss percentage.
What is an acceptable fuel loss tolerance?
The acceptable tolerance is whatever the company, the contract or the governing authority has set in writing; there is no universal figure. A useful limit always states its basis, period, product and temperature basis.
Is an ATG enough to detect fuel losses?
No, an ATG shows tank contents but not where missing product went. It detects leaks in idle tanks well; transfer losses need comparison with meters and documents, and small losses need trends over several days.
How do electronic seals help reduce losses?
Electronic seals record every opening and closing of a tank-truck compartment during the trip. That gives evidence for losses between the terminal and the fuel station, which terminal reconciliation cannot see.
Why can fuel losses be negative?
Fuel losses become negative, a gain, when measured stock exceeds book stock. Gains usually come from measurement or temperature effects, such as uncorrected volumes or meter drift, and deserve the same investigation as losses.
Can evaporation losses be calculated?
Yes, evaporation losses can be estimated with API MPMS Chapter 19.1 for fixed-roof tanks and Chapter 19.2 for floating-roof tanks. The methods use tank construction, roof fittings, vapour pressure and weather data.
Sources and further reading
- Petroleum Measurement catalog: MPMS Chapters 12.1.1, 19.1 and 19.2 (opens in a new tab)
- Volume correction factors: gasoline, density 730 kg/m3 at 15 °C (Table 54B) (opens in a new tab)
- OIML R 85-1 & 2: Automatic level gauges for measuring the level of liquid in stationary storage tanks (opens in a new tab)
- CATALYST Digital Seal (CT-PS) (opens in a new tab)
- Pertamina Pulau Baai: Smart Seal development (opens in a new tab)
- Pertamina Jambi Terminal: integration of meters 5 and 6 (opens in a new tab)
- Cover photo by Aspiring environmentalist, CC BY-SA 4.0 (cropped and colour graded) (opens in a new tab)
Next step
Prepare the technical discussion for your facility.
Bring the equipment list, diagrams and symptoms you have. The Citia team helps map the next step.
Related products and solutions
- KnowledgeVolume correction factor (VCF) and ASTM Table 54B explainedA volume correction factor (VCF) converts fuel volume at the measured temperature into volume at 15 °C. For refined products it comes from Table 54B.
- KnowledgeWhat is a tank management system? From level readings to tank tickets and stockA tank management system (TMS) collects ATG data from every tank, calculates standard volume, records stock movements and issues tank tickets.
- KnowledgeElectronic seals and fleet data: protecting fuel from terminal to stationAn electronic seal records every opening of a tank-truck compartment with time and location. See how seals and fleet data work together from terminal to station and how to respond to an alert.
- ProductINTEGRA TMSCollects ATG readings from every tank for live levels, history, tank tickets and stock posting to SAP.
- ProductCATALYST Digital SealElectronic seals on tank-truck compartments that report every open and close.
- ProjectPertamina Pulau Baai: Smart Seal developmentSmart Seal Lock secures fuel delivery from the terminal to the destination fuel station (SPBU); the project covered design and installation on tank trucks.
- ProjectPertamina Jambi Terminal: integration of meters 5 and 6Citia integrated Meter 5 and Meter 6 into the CS Flow application at the Pertamina Jambi Fuel Terminal filling shed, from MUI and PLC I/O to commissioning.
- ProjectCikampek tank-monitoring upgradeTMS, integration and field testing