
Control systems
HMI design that helps operators: layout, colour and alarms
Good HMI screens make abnormal states stand out, use colour only for meaning and go from overview to detail. ISA-101 practice, alarm load and field notes.
- Topic
- Control systems
- Updated
- 13 November 2026
- Reading time
- 6 min
- Sections
- 7
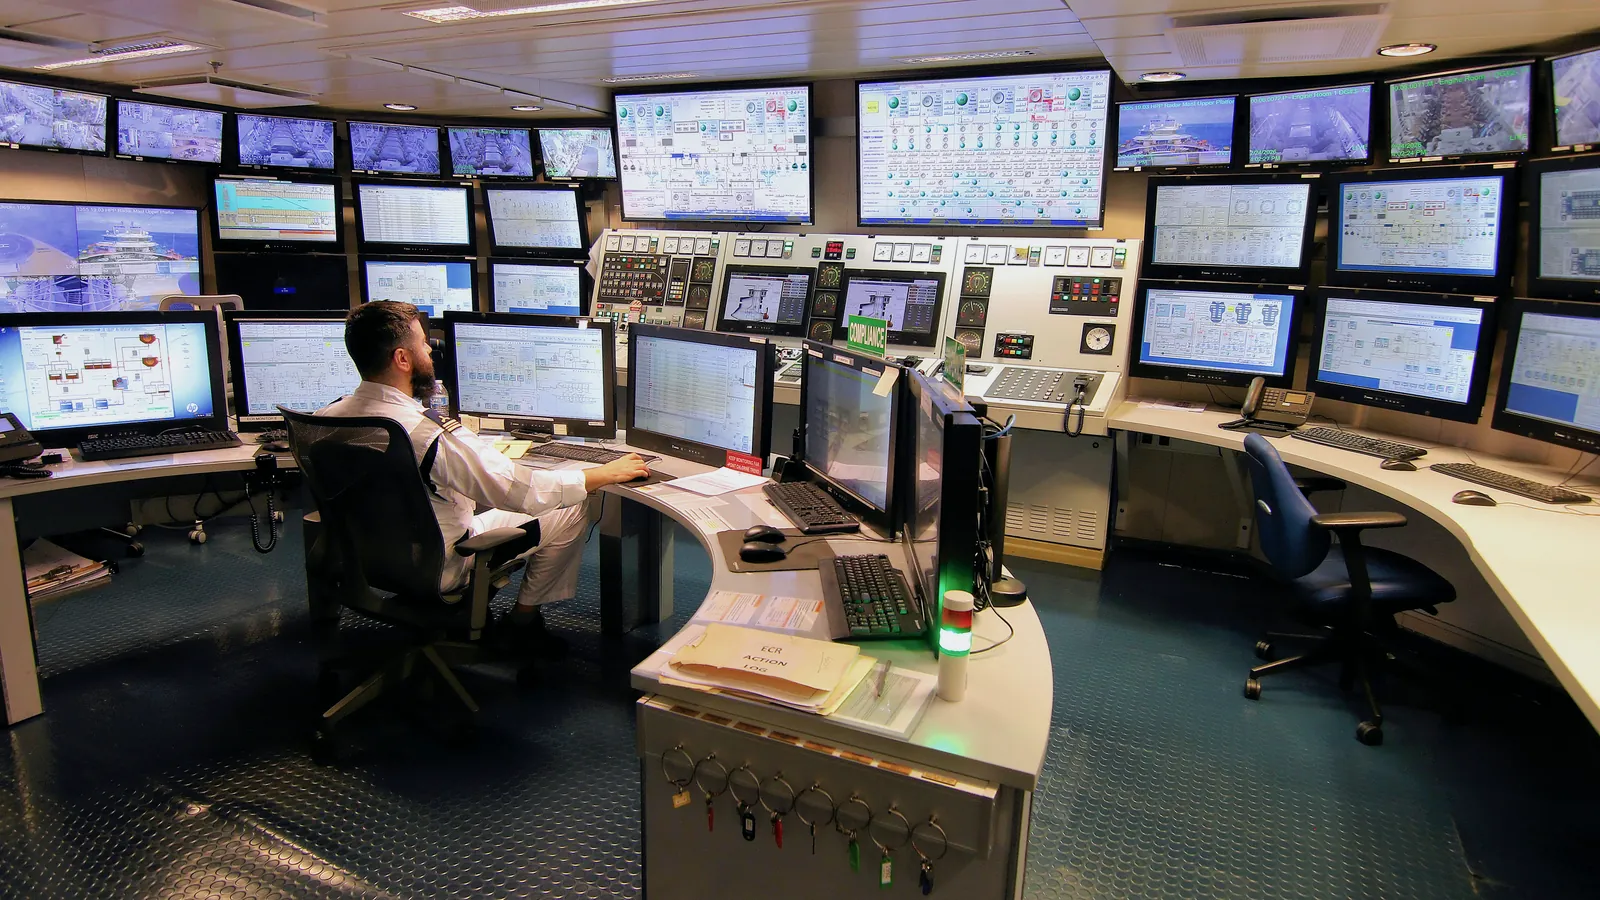
A good HMI screen makes abnormal conditions stand out more than normal ones, uses colour only for specific meanings, and arranges information from overview to detail.
An HMI (human machine interface) is the screen where an operator sees the process and gives commands. It can be a small panel on one machine or a set of operator stations on top of a SCADA system or a DCS. This guide is about the design of those screens: layout, colour, hierarchy and alarms, with notes from Citia projects.
Purpose
What an HMI is for
An HMI exists so that an operator notices a problem early and acts correctly. Everything on the screen should serve that purpose.
In a PLC system, the HMI shows the machine state, accepts start and stop commands and displays faults. In SCADA or a DCS, operator stations add plant-wide overviews, trends, alarm lists and navigation across many units. The ISA-101 series, published by the International Society of Automation, covers how such interfaces are designed, deployed, operated and maintained, with improved situational awareness as one of its stated aims.
Situational awareness means the operator knows what is happening, understands what it means and can predict what comes next. A screen packed with bright pump icons and live numbers can look impressive and still fail that test, because the one value that matters is lost among the rest.
At a fuel terminal, HMIs appear at several levels: a panel on the loading gantry or pump skid, the SCADA stations in the control room, and sometimes a DCS. Each should follow the same style rules. Otherwise an operator who moves between them reads the same colour in two different ways, and a habit learned on one screen becomes a mistake on another.
Comparison
Older screens vs ISA-101-style screens
Many plant screens were drawn to look like the equipment. Newer practice draws them to show the state of the process.
The difference is easiest to see side by side. The table describes the two styles in general terms; it is not a copy of any client screen.
None of this means old screens must be thrown away. The value of the comparison is in the questions it raises: does each colour on this screen mean something, and can a new operator find the one abnormal value without help?
| Criterion | Older style | ISA-101 style |
|---|---|---|
| Background | Black or bright colours | Neutral grey, low contrast |
| Colour | Red and green for running and stopped | Colour reserved for alarms and abnormal states |
| Equipment | 3D pumps and tanks, animated | Simple flat shapes |
| Values | Raw numbers everywhere | Trends and bars against normal ranges |
| Alarms | Flashing text across the screen | Priority shown by colour and shape |
| Navigation | Flat list of pages | Hierarchy from overview to detail |
Structure
A display hierarchy from overview to detail
A display hierarchy is a planned set of screens, each with a clear job, arranged from the widest view to the narrowest. The operator starts at the top and drills down only when needed.
The four-level structure on the right is the one most often used with ISA-101. Level 1 answers whether the whole area is normal. Level 2 is where most daily operation happens. Levels 3 and 4 hold detail and diagnostics that operators visit less often and maintenance staff visit more.
The hierarchy also guides the work. Building Level 2 screens for every unit first, then adding detail, gives operators something usable early and avoids hundreds of pages nobody navigates.
Level 1: area overview
Key values and abnormal states for the whole area on one screen.
Level 2: unit control
Everything needed to run one unit, such as a pump station or loading area.
Level 3: equipment detail
One tank, pump or valve with faceplates and interlocks.
Level 4: diagnostics
Communication status, device health and support information.
Colour
Colour with a meaning
On a good HMI, colour is a signal, not decoration. If everything is colourful, nothing stands out.
That is why modern screens use grey backgrounds and muted equipment, and keep strong colours for alarms. A running pump does not need to glow green, because running is the normal state; a pump that tripped needs to be noticed. Colour also should not be the only cue, since some operators have reduced colour vision and screens fade. Pair each alarm colour with a shape or a label.
Text size and contrast matter as well. Values must be readable from the operator's normal seat, and low-contrast grey designs should be tested on the real monitors in the real room, because a screen that looks fine on an engineer's laptop can wash out on a control room display.
Write the colour rules into an HMI style guide before drawing the first screen, and apply them to every vendor's package on site. The example on the right shows the kind of table such a guide contains.
- Grey tones
- Normal equipment and background (example)
- Dark text
- Live values in the normal range
- Red (example)
- Highest alarm priority only
- Yellow or orange (example)
- Lower alarm priority only
- Outline or hatch
- Out of service, bad data quality
Alarms
Alarms an operator can actually handle
An alarm is a request for the operator to act. If the screen raises more requests than a person can handle, the important ones get missed.
ISA-18.2-2016 is the ISA standard for managing alarm systems in the process industries. A Control Engineering article on implementing it, published by Yokogawa in 2013, gives the alarm rates from the standard as practical limits of human capability; the figures are shown below. Use them as a yardstick when reviewing an alarm list, not as a target to fill.
The work that fixes an alarm list is called rationalisation. Each alarm is reviewed for its cause, its consequence, the operator action and its priority, and alarms that need no action are removed or turned into events. ISA-18.2 places this step inside an alarm management lifecycle, so the list stays clean after the project ends.
False alarms are as harmful as too many real ones. At the Lomanis fuel terminal, Citia traced alarms one by one through the DCS alarm and event log after a power failure, separated genuine from false ones and corrected the alarm logic, because persistent false alarms can draw attention away from real process alarms. See the Lomanis alarm clean-up.
- ~150alarms per day: very likely acceptableISA-18.2, via Control Engineering (2013)
- ~300alarms per day: maximum manageableISA-18.2, via Control Engineering (2013)
- ~6alarms per hour on average: very likely acceptableISA-18.2, via Control Engineering (2013)
- ~12alarms per hour on average: maximum manageableISA-18.2, via Control Engineering (2013)
From the field
Field notes from HMI and SCADA work
Most HMI work at Indonesian sites is adding data to existing screens or fixing screens that no longer match the plant. The examples come from Citia project records.
- At Eltech in Bekasi, busbar power, humidity and temperature data that could only be seen locally were brought into the central SCADA. Validating the Modbus register mapping was essential so the values on screen matched the devices. See the Eltech HMI integration.
- At the Pertamina Bitung integrated terminal, an AVEVA InTouch HMI in the central control room now shows pump pressure and VSD status, so operators no longer walk to the field to check them. See the Bitung pump restoration.
- At the Balongan effluent water treatment plant, PLC, HMI and SCADA integration went through loop checks, I/O tests, functional tests and a site acceptance test before handover. See the Balongan EWTP work.
At Lomanis, the review also found DCS pages that were not updating and product tanks on the HMI that might differ from the real ones. Screens drift away from the plant when changes in the field are not carried back into the graphics.
Checklist
A checklist before signing off a screen
A short checklist catches most HMI problems before operators meet them. Run it with an operator in the room, not only with the engineer who drew the screen.
The items below are practical checks rather than clauses from a standard. They fit any package, from a local panel to a SCADA or DCS station. For how the HMI fits next to PLCs, DCS and SCADA, see PLC vs DCS vs SCADA vs HMI.
Repeat the checklist after every significant change, such as new equipment, a protocol gateway or a SCADA upgrade. Screens rarely break at handover; they drift over the years that follow.
Abnormal stands out
Find the one tripped pump on the overview in seconds.
Values have context
Key values show their normal range or trend.
Colour follows the guide
No colour used without a defined meaning.
Bad data is visible
Lost communication shows as bad quality, not a frozen number.
Commands are confirmed
Each command button tested against real field feedback.
Navigation is short
Any unit screen reachable in a few clicks from the overview.
Terms to know
- HMI
- Human machine interface: the screen where an operator sees the process and gives commands.
- ISA-101
- The ISA series of standards and technical reports on HMIs for process automation.
- Display hierarchy
- A planned set of screens arranged from overview to detail.
- Faceplate
- A small pop-up window for one device, with its status, values and command buttons.
- Trend
- A chart of a value over time, used to see direction rather than a single number.
- Alarm flood
- More alarms arriving than an operator can read and act on, usually during an upset.
- Situational awareness
- Knowing what is happening, what it means and what is likely to happen next.
- Alarm priority
- The ranking that tells an operator which alarm to handle first.
Frequently asked questions
Why do modern HMI screens use so much grey?
Modern HMI screens use grey so that colour can be saved for alarms and abnormal states. When the normal plant is calm and neutral, a tripped pump or a high level stands out at a glance.
How many alarms per operator is reasonable?
ISA-18.2 guidance, as reported by Control Engineering, treats about 150 alarms per day as very likely acceptable and about 300 per day as the maximum manageable. Hourly, that is about 6 and 12 on average.
What is ISA-101?
ISA-101 is the ISA series on human machine interfaces for process automation, built around the standard ISA-101.01-2015. It guides how HMIs are designed, deployed, operated and maintained over their lifecycle.
What is the difference between HMI and SCADA?
An HMI is the screen, while SCADA is the system that collects data from many controllers and serves many screens. A SCADA operator station is an HMI, but a local HMI panel on one machine is not SCADA.
Can old HMI screens be improved gradually?
Yes, start with an HMI style guide and the overview and unit screens operators use most, then convert detail screens over time. Changing everything at once risks confusing operators during an upset.
Should an HMI screen copy the P&ID?
No, an HMI screen should show what the operator needs to run the process, not every pipe and instrument from the P&ID. Detail belongs on lower-level screens; the overview should highlight state and deviations.
Sources and further reading
- ISA-101 Series of Standards (opens in a new tab)
- ISA-101.01-2015, Human Machine Interfaces for Process Automation Systems (opens in a new tab)
- ISA-18.2-2016, Management of Alarm Systems for the Process Industries (opens in a new tab)
- Implementing Alarm Management per the ANSI/ISA-18.2 Standard (Control Engineering) (opens in a new tab)
- Eltech: HMI IP integration (opens in a new tab)
- ABB DCS programming at Lomanis fuel terminal (opens in a new tab)
- Cover photo by Larry D. Moore, CC BY 4.0 (cropped and colour graded) (opens in a new tab)
Next step
Prepare the technical discussion for your facility.
Bring the equipment list, diagrams and symptoms you have. The Citia team helps map the next step.
Related products and solutions
- KnowledgeWhat is SCADA? Components, architecture and industrial examplesSCADA collects data from PLCs, RTUs and instruments, shows it to operators and sends supervisory commands. Components, architecture and real plant examples.
- KnowledgePLC vs DCS vs SCADA vs HMI: what each one doesPLCs and DCSs run control logic, SCADA supervises many controllers and an HMI is the operator screen. A side-by-side table, plant layers and how to choose.
- KnowledgeOEE explained: formula, examples and the machine data you needOEE is the share of planned production time that makes good parts at the ideal speed. This guide gives the formula, a worked shift and the machine data needed.
- ProjectEltech: busbar panel monitoring into central SCADAPower, humidity and temperature monitoring on an Eltech busbar panel was added to the existing central SCADA through a LAN-to-Ethernet converter and Modbus.
- ProjectBalongan EWTP controls & instrumentationPanels, PLC, HMI/SCADA, instrumentation and testing
- ProjectABB DCS programming at Lomanis fuel terminalTroubleshooting and recovery of the ABB System 800xA DCS at the Lomanis fuel terminal.
- ProjectPertamina Bitung integrated terminal: pump VSD and SCADA restorationRestoration of the field VSD pump system at the Bitung integrated terminal: new VSD units and pressure transmitter, fiber optic cable and AVEVA InTouch SCADA.
- KnowledgePLC/SCADA assessment: start with symptoms, topology and backupsSeparate equipment, communications, applications and operating processes before deciding on replacement.