
Process Safety
Pipeline pressure monitoring and leak detection for fuel pipelines
Pipeline pressure monitoring reads transmitters at several points and flags drops that do not fit the operating pattern; locating a leak needs extra methods such as line balance.
- Topic
- Process Safety
- Updated
- 13 November 2026
- Reading time
- 6 min
- Sections
- 6
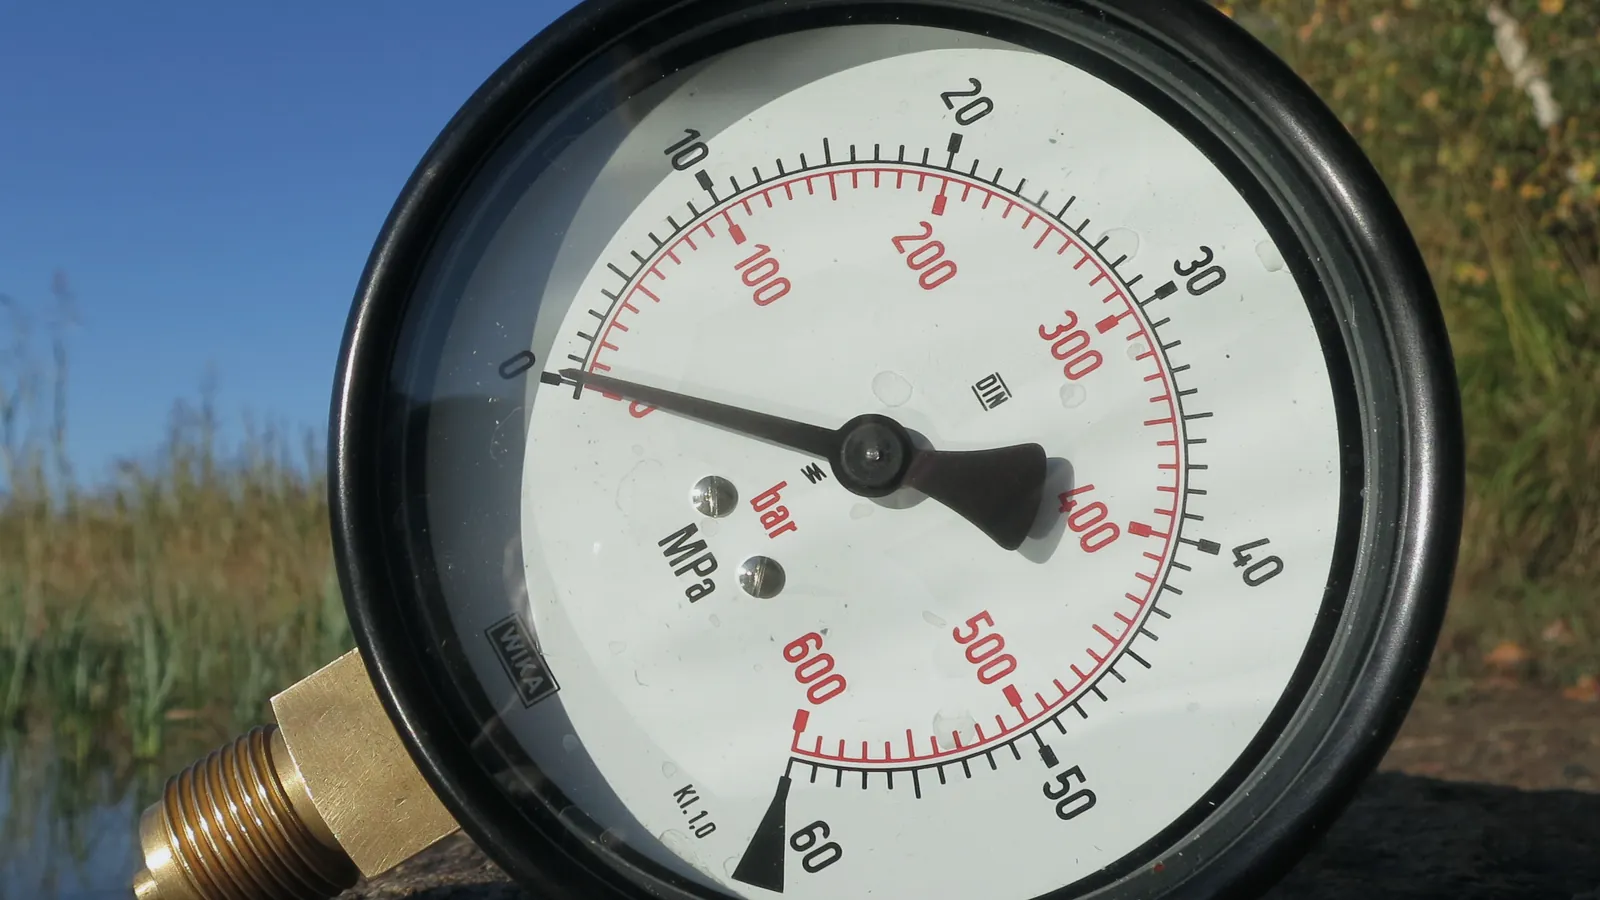
Pipeline pressure monitoring is the continuous reading of pressure transmitters at several points along a pipeline, shown to operators with history and alarms. A pressure drop that does not fit the operating pattern, such as a pump change or a valve move, can point to a leak. Locating it and judging its size needs extra methods, for example line balance or the analysis of pressure waves.
This guide explains how a monitoring system is built, how to read a pressure trend, which leak detection methods exist and where the limits lie. Newcomers get a plain explanation first in each section, and engineers get the design detail after it. The examples come from fuel pipelines between terminals and booster stations.
Architecture
What a monitoring system consists of
A pressure transmitter turns pressure into an electrical signal, usually 4-20 mA, and the rest of the system carries that signal to a screen. The pieces are the same on a short pump line and on a transmission pipeline, only the distances change.
Installed at chosen points on the pipe, with isolation valves so they can be removed and calibrated.
Hover, focus or tap a step to read its note.Citia's CATALYST PressMon follows this chain. It links pressure transmitters on a pipeline to a PLC or HMI, an industrial network and a dashboard. Operators see each measuring point live, review history when they investigate a fault and get alarms when pressure leaves its range. Alarms and interlocks follow the facility's control design. For the signal side, see how 4-20 mA and HART instruments send data.
Typical alarm levels are low-low, low, high and high-high. Many sites add a rate-of-change alarm, since a fast fall is often more telling than a slow one, and a comparison between neighbouring points on the same pipe. Levels come from the line's design pressure and operating envelope, so they are set per pipeline.
Transmitter quality decides data quality. Mount each transmitter with an isolation valve and a vent so it can be checked without stopping the line, and keep its calibration record. Choose a range that fits the design pressure with margin for surge: a range that is too wide loses resolution, and one that is too narrow clips the peaks.
Data
Reading a pressure trend
Pressure on a working pipeline is never flat. It rises when a pump starts, falls when a valve opens downstream and changes with the product in the line. A leak adds one more change, and the skill is telling it apart from the others.
Illustrative pressure at a downstream point
| Label | Value |
|---|---|
| T1 | 8.1 bar |
| T2 | 8 bar |
| T3 | 8.1 bar |
| T4 | 8 bar |
| T5 | 8.1 bar |
| T6 | 8 bar |
| T7 | 7.4 bar |
| T8 | 6.6 bar |
| T9 | 6.2 bar |
| T10 | 6.1 bar |
What to look for
- A fall that keeps going, where a valve move would level off.
- The same fall at neighbouring points, or only at one of them.
- Pressure that does not match the flow and the pump state.
- A fall that starts before any operator action.
Comparing neighbouring points is powerful. If a drop appears at the transmitter just downstream of a pump and not further along, the cause is probably the pump or its valve. If it travels along the line, something is happening in the pipe. Event history from the control system, such as pump starts and valve commands, is what allows this reading.
Operators also need context on the same screen. Show pump status, valve positions and flow next to the pressure trend, so an anomaly can be judged without opening four other displays.
The weak spots are also well known. Small leaks sit inside the noise. Product changeovers and temperature changes move pressure without any leak. A transmitter that has drifted can look like a slow leak, which is why calibration records matter. For that reason, pressure monitoring is usually the first layer of leak detection and seldom the last.
Methods
Leak detection methods compared
Computational pipeline monitoring (CPM) is the name for software that watches pipeline data and helps the controller spot hydraulic anomalies. API RP 1130 covers it for liquid pipelines. API RP 1175 looks at the whole leak detection program, including control room procedures, training and the testing of equipment and alarms.
Monitoring is also a question of organisation. Decide who watches the screen, who is called when an alarm fires and how long a pressure alarm may stay open before it is escalated. Written procedures and regular drills turn a technical alarm into a response that actually happens.
| Criterion | Pressure and rate of change | Line balance | Negative pressure wave | Fibre-optic or sensing cable |
|---|---|---|---|---|
| How it works | Watches pressure levels and how fast they fall | Compares volume in with volume out, corrected for line pack | Sensors at two points time the pressure wave a sudden leak sends both ways | A cable along the pipe senses leaked product, heat or vibration |
| Strength | Uses instruments the pipeline already has | Sees slow leaks over a longer time | Can estimate the leak location | Can pinpoint the spot along the cable |
| Weak point | Does not locate the leak by itself | Needs good flow meters and clean data | Misses slow leaks, and needs fast sensors | Costly to install along a long existing line |
| Needs | Transmitters at several points | Metered flow at both ends | Fast sampling and synchronised time | A cable or sensing fibre run with the pipe |
No single method is best everywhere. Sites combine methods so that each covers the gap of another. The design question is not which one to buy, but what leak size, detection time and location accuracy the operator needs, and what the pipeline's instruments can support.
Real-time transient modelling goes a step further. A hydraulic model of the line runs next to the real pipe, and the system compares the model with the measurements. It can see smaller leaks than simple trend watching, but it needs a calibrated model, good instruments and time to tune.
Design
How many transmitters, and where
There is no fixed number of transmitters per kilometre. The count follows the hydraulic profile of the line, the valve and pump layout and the detection target. Common positions are:
- both ends of each pipeline section;
- suction and discharge of each booster pump;
- either side of block valves and metering stations;
- high and low points, and sensitive crossings.
The Citia prototype for the Balongan to Plumpang pipeline shows the idea on a small scale. The real system is designed around continuous pressure monitoring on the section that passes three booster pumps. In the miniature, one DC booster pump and two measuring points, PT-01 and PT-02, stand for the pressure change before and after a pump. Read more in the PressMon prototype for Balongan.
Hazard
Surge pressure and fast shutdowns
Surge pressure, also called water hammer, is a sudden pressure rise caused by a fast change in flow, such as a valve closing quickly or a pump tripping. The moving liquid has momentum, and when it is stopped abruptly the pressure wave travels through the pipe. It can damage flanges, instruments and supports even when the average pressure looks normal.
For monitoring, the lesson is about sampling. A transmitter that is read once every few seconds can miss the peak of a fast surge. For design, the lesson is about the valves: closure times, relief devices and shutdown logic need to be set with surge in mind.
Slow closing is not always the answer. A valve that closes too slowly lets more product pass during an emergency, so the closure time is a compromise that the hydraulic study sets. Citia's bulletin on ESD for booster pumps on transmission pipelines covers the safety side, and ESD, SIS and interlock explains how the shutdown function is classified.
Commissioning
Proving the system before it is trusted
Loop check each transmitter
Apply a known pressure and confirm the value on the screen, including units and range.
Set and test alarm levels
Drive each alarm from a simulated value and confirm the text, the priority and who is notified.
Cut the link on purpose
Disconnect a transmitter or a communication path and confirm it shows as a fault, not as a flat trend.
Check the history
Confirm readings and alarms are stored with correct times, and that they can be exported.
Train the operators
Walk through an alarm scenario so operators know what to check first and whom to call.
Citia's PressMon communication restoration at Balongan is a field example of why the link matters. The work covered replacing fibre-optic converters, panel assembly, installation, restoring the connection and function tests, with checks of SCADA and web displays and alarm functions. A PressMon reference at TBBM Plumpang shows the web-based view with log history and alarms for abnormal conditions.
At Pertamina Priok, pressure and temperature transmitters and gas detectors feed the control system. When a value leaves its range, it raises an alarm and sends a trip command to the shutdown valve. That is monitoring connected to action.
The same data helps outside emergencies. A pressure history that shows how the line behaves at each pump change gives maintenance a baseline for pump wear, partly blocked strainers and valve problems. Alarm levels also need a review after commissioning: read the first months of alarm history, remove alarms that fire without any action and adjust levels, following the alarm management practice in ISA-18.2.
Terms used in this article
- Pressure transmitter
- An instrument that senses pressure and sends it as an electrical signal, usually 4-20 mA.
- CPM
- Computational pipeline monitoring, software that helps spot hydraulic anomalies.
- Line pack
- The volume of product stored in the pipe, which changes with pressure and temperature.
- Line balance
- A comparison of the volume entering and leaving a pipeline section.
- Negative pressure wave
- The short pressure drop that travels both ways from a sudden leak.
- Surge pressure
- A sudden pressure rise caused by a rapid change in flow, also called water hammer.
- Rate-of-change alarm
- An alarm that triggers on how fast a value moves rather than on its level.
Frequently asked questions
Can pressure monitoring detect a small leak?
Sometimes, but not reliably on its own. A small leak moves pressure less than the normal swings of pumping and valve operation, so it can hide in the noise. Adding line balance, careful trend comparison and good instrument records improves the chance of seeing it.
How many pressure transmitters does a pipeline need?
There is no fixed number. The count follows the hydraulic profile, the pump and valve layout and the detection target. Common positions are both ends of each section, either side of booster pumps and block valves, and the high and low points of the line.
What is surge pressure in a pipeline?
Surge pressure is a sudden pressure rise caused by a fast change in flow, such as a quickly closing valve or a pump trip. The wave can damage flanges and instruments, so valve closure times and shutdown logic are designed with it in mind.
What leak detection methods exist for pipelines?
Common methods are pressure and rate-of-change monitoring, line balance, real-time transient modelling, negative pressure waves and fibre-optic or sensing cables. Most sites combine two or more, because each one covers a different leak size or gives a different level of location accuracy.
What do API RP 1130 and API RP 1175 cover?
API RP 1130 covers computational pipeline monitoring for liquids, meaning software tools that help the controller recognise hydraulic anomalies. API RP 1175 covers how a leak detection program is managed, including control room procedures, training and testing of equipment and alarms.
Why does a monitoring dashboard sometimes show a flat line?
A flat line can mean a stable pressure, a frozen value or a lost communication link. The way to tell them apart is a quality flag and a stale-data alarm on each reading, so a dead link appears as a fault and not as calm.
Sources and further reading
- API Recommended Practice 1130, Computational Pipeline Monitoring for Liquids (opens in a new tab)
- API Recommended Practice 1175, Pipeline Leak Detection, Program Management (opens in a new tab)
- API Enhances Pipeline Safety with Two Updated Standards (RP 1130 and RP 1175) (opens in a new tab)
- ISA-18.2-2016 Management of Alarm Systems for the Process Industries (opens in a new tab)
- CATALYST PressMon, pipeline pressure monitoring (opens in a new tab)
- PressMon prototype for Balongan (opens in a new tab)
- Balongan PressMon communication restoration (opens in a new tab)
- Cover photo by R. Henrik Nilsson, CC BY 4.0 (cropped and colour graded) (opens in a new tab)
Next step
Prepare the technical discussion for your facility.
Bring the equipment list, diagrams and symptoms you have. The Citia team helps map the next step.
Related products and solutions
- Knowledge4-20 mA and HART: how field instruments send dataA 4-20 mA loop sends a measurement as current; HART adds digital data on the same wires. How the loop works, how to convert mA to a value, and how to read faults.
- KnowledgeIndustrial IoT gateways and telemetry: getting remote-site data to a dashboardAn industrial IoT gateway reads field devices, buffers data when the network drops and sends it to a server. How telemetry differs from SCADA and how to choose a gateway.
- ProductCATALYST PressMonLive pipeline pressure from field transmitters to the control room, with history and alarms.
- ProjectPressmon prototype for BalonganThe PressMon prototype is a miniature of the Pressure Monitoring System concept for the Balongan-Plumpang pipeline.
- ProjectBalongan PressMon communication restorationPressMon communications-network and panel maintenance
- ProjectPertamina Priok: unloading and backloading system restorationPressure, temperature and gas monitoring at the Pertamina Priok port trips the shutdown valve when a limit is exceeded during unloading and backloading.
- NewsPertamina TBBM Plumpang: PressMonA reference for web-based pipeline pressure monitoring at TBBM Plumpang, with data history and abnormal-condition alarms.
- KnowledgeESD vs SIS vs interlock, and what SIL meansEmergency shutdown (ESD) brings a process to a safe state; built to IEC 61511 with a target SIL, it becomes part of a safety instrumented system (SIS).