
Electrical Monitoring
Continuous busbar and panel temperature monitoring
Sensors on busbar joints and panel hot spots show overheating between thermography rounds. This guide covers placement, alarm limits and the link to SCADA.
- Topic
- Electrical Monitoring
- Updated
- 13 November 2026
- Reading time
- 6 min
- Sections
- 8
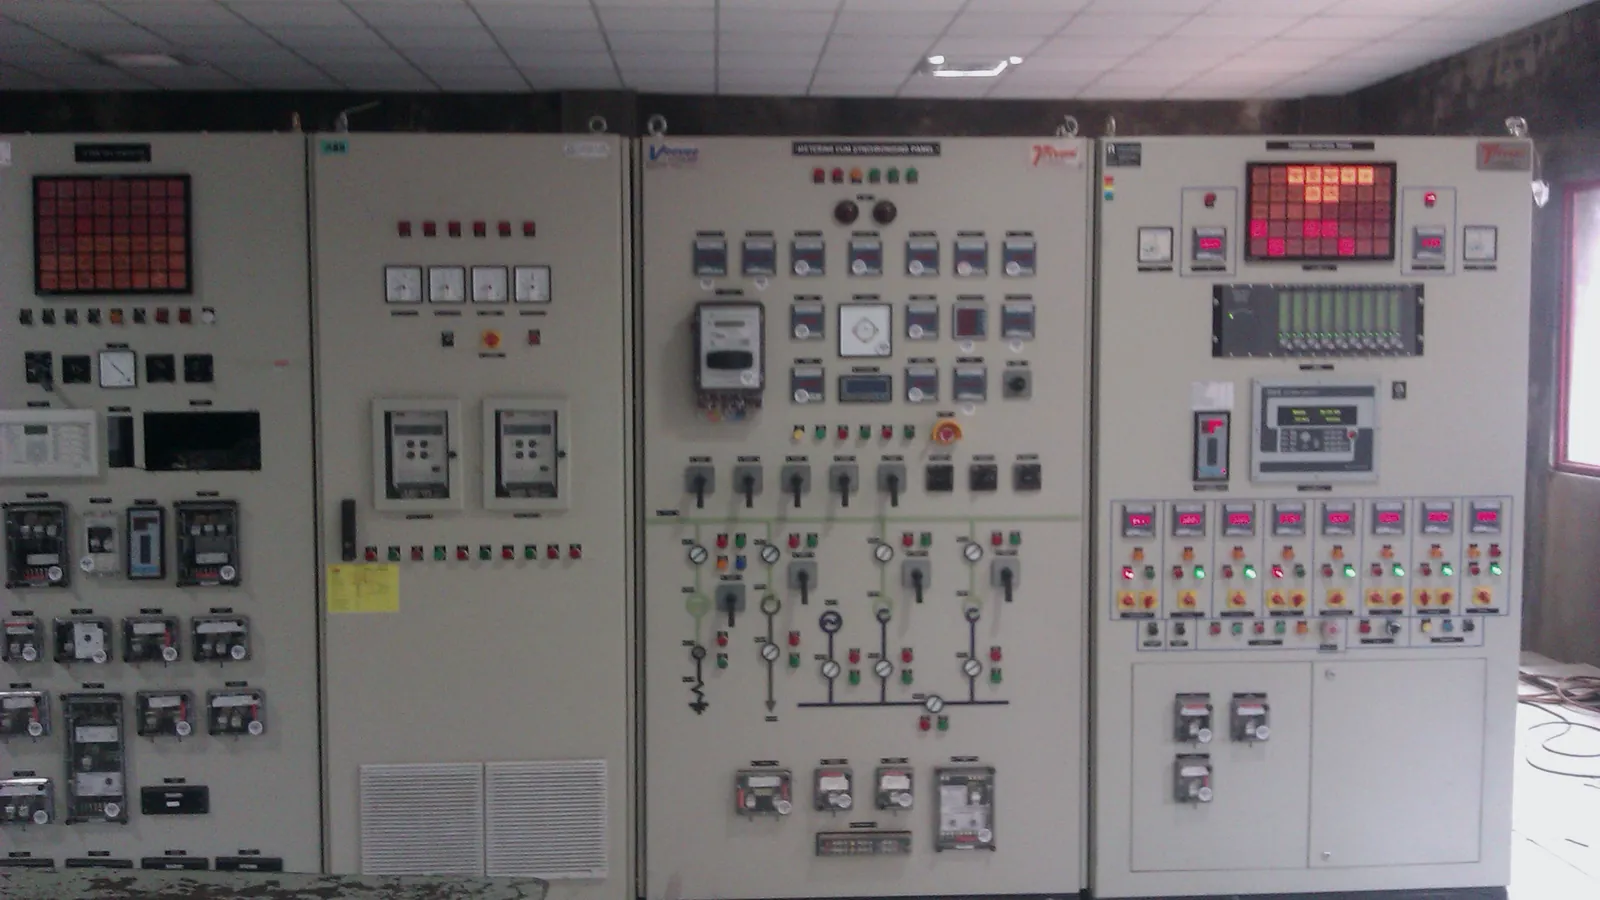
Busbar temperature monitoring uses sensors fitted on joints and other hot spots inside an electrical panel to detect rising temperature between thermography surveys, because a loose or oxidised connection heats up long before it fails.
A busbar is the solid metal bar inside a switchboard that carries current from the incoming supply to the outgoing circuits. It is the connections that give trouble: where bars are bolted together, where they meet a breaker, where a cable lug is clamped. This guide explains why those points overheat, how continuous sensing compares with periodic thermography, where to place sensors, how to bring the data into SCADA and how to set alarms that people will not ignore.
Cause
Why busbar joints overheat
A busbar joint overheats because current meets resistance there, and resistance turns current into heat. The bar itself is rarely the problem. The joints are.
Bolted joints lose clamping force through thermal cycling and vibration. Contact surfaces oxidise or collect dust and moisture. Cable lugs are crimped badly or tightened unevenly. Each case adds contact resistance. Heat in a conductor grows with the square of the current and with the resistance, so a joint that is harmless at light load can run hot at peak load. Rising temperature raises resistance further, which is why a joint can drift for months and then fail quickly.
Humidity adds a second path. Condensation, or a damp and dusty compartment, can degrade insulation and create tracking between phases. Citia’s technical bulletin on wireless monitoring of busbar temperature and humidity names a temperature spike and excess humidity as causes of insulation damage, sparks and fire, and notes that manual inspection struggles to catch fast changes.
Loosened bolts
Thermal cycling and vibration reduce clamping force.
Oxidised contacts
A film on the contact surface adds resistance.
Poor crimps and lugs
Uneven tightening leaves a high-resistance path.
Humidity and dust
Damp, dirty compartments degrade insulation.
Comparison
Thermography or continuous sensors?
Both methods find hot spots. They differ in when and how often. Infrared thermography is a survey: a technician looks at the panel with a thermal camera and records an image on that day. Continuous monitoring is a trend: sensors report day and night at fixed points.
A survey sees every visible joint, but only at the moment of the survey, and only if the panel is loaded and accessible. A sensor sees only its own point, but it sees it during the night shift, on the peak-load day and over the weekend. The two complement each other. Thermography shows where to put sensors, and sensors cover the time between rounds.
NFPA 70B, Standard for Electrical Equipment Maintenance, is the usual reference for planning inspection and maintenance of electrical equipment. Continuous temperature data can feed such a programme, but it does not replace the programme.
| Criterion | Periodic thermography | Continuous sensors |
|---|---|---|
| Coverage | Every joint the camera can see | Selected points only |
| Timing | A snapshot on the survey day | A trend, day and night |
| Load needed | Panel must be loaded during the survey | Records whatever load occurs |
| Access | Technician at the panel, often with covers off or infrared windows | No visit once installed |
| Alarm between rounds | None | At the limits you set |
| Cost shape | Labour for each round | Hardware and gateway up front |
Placement
Where to place the sensors
Put sensors where heat appears first. That is almost always a connection, not the middle of a bar.
Typical points in a low-voltage or medium-voltage panel:
- incoming terminals and the first bolted joint after them
- bar-to-bar joints between sections
- tap-off points to outgoing feeders
- breaker or contactor stab connections
- cable lug terminations on the heaviest circuits
Add a humidity sensor in the compartment where condensation is most likely, away from heaters and ventilation openings. Citia’s busbar monitoring system uses temperature sensors at selected busbar points and a humidity sensor in the panel, joined by a gateway.
Survey at normal load
Run a thermography round and mark the warmest joints.
Rank the joints
Order them by current carried and by how often they were opened.
Choose the points
Start with the top of the list and add points as budget allows.
Fit with the panel de-energised
Work under permit to work and lockout-tagout.
Record a baseline
Log each point against load for a few weeks before setting alarms.
Safety
Wireless sensors in a live panel
Wireless sensors remove the need to pull signal cable through live compartments, which is the main reason to use them in a panel that is hard to open.
Fit them while the panel is de-energised, under permit to work and lockout-tagout. Check the sensor and its mounting against the voltage class of the panel and the temperature it will see, and confirm that nothing in the mounting reduces clearances. A metal enclosure weakens radio signals, so decide the antenna position early and test the link with the doors closed.
Citia lists CATALYST CT-WTS and CATALYST CT-WHS as sensors that read assets without new signal cabling and feed the same data path. Ratings and approvals differ per product and per panel, so ask the manufacturer for the voltage class and mounting limits before you choose points.
Sensor health is part of the design. Ask how each sensor reports its own status, how long it runs on its power source and what the gateway does when a sensor goes silent. A monitoring system that fails quietly is worse than none, because people stop doing the rounds once they believe the panel is watched. Plan a periodic check of every sensor against a handheld reference, and log the result.
Alarms
Setting alarm limits that hold up
Do not copy one temperature from a datasheet into the alarm. Set limits in tiers, based on the panel maker’s data and on what each point does under normal load.
IEC 61439-1 sets temperature-rise limits for low-voltage assemblies, verified at rated current under defined conditions. Those limits are a design check, not a field alarm. The field limit for a point depends on the part it touches, the insulation nearby and the ambient temperature. Ask the panel maker for the limit per component and put the warning level below it.
Three signals work better than one. Absolute temperature catches a joint that is already hot. Rise above ambient, or above the same point last week at the same load, catches drift. The difference between phases at the same position catches a single bad joint when the load is balanced.
Alarm tiers for one point
- Baseline
Learn normal
Log temperature against load for a few weeks.
- Watch
Drift detected
Same load, higher temperature than the baseline. Add it to the next inspection.
- Warning
Limit approached
Phase difference or absolute level crossed. Plan a de-energised check.
- Action
Act now
Reduce load or isolate the circuit as the site procedure allows.
# Example only. Limits come from the panel maker and the site baseline.
point: PNL-12/BUS-A/L1-JOINT-3
rules:
  - name: absolute_warning
    when: temperature > <warning_limit_from_panel_maker>
  - name: phase_difference
    when: abs(temperature - temperature_of_peer_phase) > <delta_from_baseline> for <duration>
  - name: drift
    when: rise_above_ambient > baseline_at_same_load + <margin> over <days>
  - name: sensor_fault
when: no_reading for <timeout>Data
Reading the trend
A temperature trend tells a story only if you know the load. Plot each point against the current on its circuit, not against time alone.
A healthy joint rises and falls with load and with ambient temperature, and its curve repeats from day to day. A joint with growing contact resistance shows the same shape but sits higher each week at the same load. One phase that runs above its two neighbours at balanced load points to a single joint, not to the panel as a whole. A rise that appears with no change in load is the pattern to act on first, because the heat source is local.
Maintenance leaves its own marks. A step down after a torque check suggests the joint had loosened. A step up after reassembly suggests a lug seated badly. Keep a log of work done on the panel beside the trend, so these steps are explained instead of puzzled over, and so the next technician knows which joints were touched and when.
Integration
Getting the data into SCADA
Sensor readings are useful only if someone sees them. The usual route is sensor, gateway, then SCADA or a web dashboard.
Wireless sensors report to a gateway. The gateway exposes the readings as Modbus registers, or over another industrial protocol, so SCADA reads them like any other device. The basics are in the Modbus guide. Citia’s Eltech HMI IP integration shows what the work involves. Power, humidity and temperature monitoring on a busbar panel had been visible only locally. The team added a LAN-to-Ethernet converter, configured Modbus communication and addressing, aligned the IP addresses with the SCADA network and validated the values on the central screen.
The lesson from that project applies everywhere: validate the register or address mapping, because a mismatch gives a plausible but wrong number. Commission in stages, from device link to network to Modbus data to SCADA, and document IP addresses, Modbus addresses and the register map for whoever troubleshoots next.
Mounted at selected joints and hot spots.
Hover, focus or tap a step to read its note.Limits
What monitoring does not replace
Continuous sensors report a symptom. The repair is still a de-energised job with a torque wrench, a clean contact surface and a record of what was found.
A sensor sees only its own point, so a hot joint without a sensor stays hidden. Keep the periodic thermography round and the mechanical checks. Treat the sensors as instruments too: alarm on lost readings, so a dead battery or a blocked radio path does not look like a healthy panel. Review the sensor list after any panel modification, because new joints are new places to fail.
Terms used in this article
- Busbar
- A metal bar inside a panel that carries current and distributes it to outgoing circuits.
- Thermography
- Imaging with an infrared camera to show surface temperature.
- Contact resistance
- The resistance at a joint where two conductors touch.
- Temperature rise
- The difference between a part’s temperature and the ambient temperature.
- Tap-off
- The point where a feeder branches from a busbar.
- Gateway
- A device that collects readings from sensors and passes them on in a standard protocol.
- Baseline
- The normal temperature of a point at a given load, learned over several weeks.
- Tracking
- A conductive path that forms across damp, dirty insulation and can lead to a fault.
Frequently asked questions
What is a busbar in an electrical panel?
A busbar is a metal bar, usually copper or aluminium, that carries current inside a switchboard and distributes it to outgoing circuits. It replaces many separate cables with one rigid conductor and gives breakers a place to connect.
Is a wireless sensor safe to fit in a medium-voltage panel?
It can be, if the sensor and its mounting are rated for that panel’s voltage class and qualified staff fit it with the panel de-energised. Ask the sensor manufacturer and the panel maker to confirm the rating before installation.
How much temperature rise should I worry about?
There is no universal number, because the limit depends on the component, the nearby insulation and the ambient temperature. IEC 61439-1 sets design limits for assemblies, and the panel maker can give limits per component. A joint that runs hotter than its sister phase at the same load deserves attention before any limit is reached.
How does busbar temperature data get into SCADA?
Through a gateway that collects the sensor readings and exposes them over Modbus or another industrial protocol. SCADA then polls the registers like any other device, provided the register map has been validated.
Can continuous monitoring replace thermography?
No. Continuous sensors watch selected points all the time, while thermography shows every visible joint on the survey day. Using both finds more problems than either alone.
Why monitor humidity as well as temperature?
Humidity matters because condensation and damp dust can degrade insulation and cause tracking between phases, even when temperatures look normal. A humidity sensor flags that risk before it becomes a fault.
How many sensors does a panel need?
As many as there are joints you cannot afford to miss. Start with the incoming terminals and the joints that carry the most current, then add points once the first data shows where the heat builds.
Sources and further reading
- IEC 61439-1:2020 Low-voltage switchgear and controlgear assemblies - Part 1: General rules (opens in a new tab)
- NFPA 70B, Standard for Electrical Equipment Maintenance (opens in a new tab)
- CATALYST Busbar Monitoring (opens in a new tab)
- Wireless monitoring of busbar temperature and humidity (opens in a new tab)
- Eltech: HMI IP integration (opens in a new tab)
- Cover photo by Shailesh_telang, CC BY-SA 3.0 (cropped and colour graded) (opens in a new tab)
Next step
Prepare the technical discussion for your facility.
Bring the equipment list, diagrams and symptoms you have. The Citia team helps map the next step.
Related products and solutions
- KnowledgeIndustrial IoT gateways and telemetry: getting remote-site data to a dashboardAn industrial IoT gateway reads field devices, buffers data when the network drops and sends it to a server. How telemetry differs from SCADA and how to choose a gateway.
- KnowledgeLTSA and control-system maintenance for terminals: what the contract should coverLTSA is a multi-year service contract for a terminal control system. See what the scope, service levels, backups, reports and security clauses should say, and how to judge a provider.
- KnowledgeWhat is Modbus? RTU vs TCP, registers and function codesModbus is an open protocol for industrial devices. This guide compares Modbus RTU and TCP and explains registers, function codes, frames and gateways.
- ProductCATALYST Busbar MonitoringWatches busbar temperature and panel humidity, so hot spots show up between inspections.
- ProductCATALYST CT-WTSA wireless temperature sensor for reading industrial assets without new signal cabling.
- ProductCATALYST CT-WHSA wireless humidity sensor for panels, rooms and assets without new signal cabling.
- ProductPower Monitoring SystemBrings power meters and protection relays onto one dashboard with energy history and alarms.
- ProjectEltech: busbar panel monitoring into central SCADAPower, humidity and temperature monitoring on an Eltech busbar panel was added to the existing central SCADA through a LAN-to-Ethernet converter and Modbus.
- NewsWireless monitoring of busbar temperature and humidityCovers temperature and humidity sensors in electrical panels, automatic alerts and wireless integration with web dashboards, SCADA, HMI and IoT.